
How to get started with your own uptime monitor with Docker, in minutes
Originally published at https://benlobaugh.medium.com/how-to-get-started-with-your-own-uptime-monitor-with-docker-in-minutes-693e23505c6e
I received a stressed text message, “Tomorrow will be our biggest sales day EVER! I sure hope the web servers are ready for it!”
This may be an all too familiar message for many of you who work on the web or maintain server infrastructure. In this article I am going to show you how to quickly and easily spin up an uptime monitor, using Docker.
The uptime monitoring software we will be using is from the Uptime Kuma project, available at https://github.com/louislam/uptime-kuma
With Uptime Kuma you will be able to monitor the following types of services:
- HTTP(s)
- TCP Port
- Ping
- HTTP(s) — Keyword
- DNS
- Steam Game Servers
- MQTT
- SQL Servers
Each monitor lets you specify the heartbeat interval, number of retries before flagging a failure, and a host of additional options, depending on the type of service selected (such as HTTP response code).
For alerts on downtime and service interruption, the following notification services are supported:
- Alerta
- AliyunSMS
- Apprise
- Bark
- ClickSend SMS
- DingDing
- Discord
- Feishu
- Google Chat
- Gorush
- Gotify
- Line Messenger
- LunaSeat
- Matrix
- Mattermost
- Ntfy
- Octopush
- OneBot
- PagerDuty
- PromoSMS
- Pushbullet
- Pussh by Techulus
- PushDeer
- Pushover
- Pushy
- Rocket.Chat
- SerwerSMS.pl
- Signal
- Slack
- Email (SMTP)
- Stackfield
- Microsoft Teams
- Telegram
- Webhook
- WeCom
Whew! Made it through that list?
Uptime Kuma also has built in support for custom Status Pages. That is where you can define public status views for your services. It can even be segmented by project or environment (dev, staging, prod, etc).
“I get it! Enough yammering about features! Let’s get to the good stuff”
Prerequisites
Before we get started there are a couple things you will need:
- Installed and working copy of Docker
- Basic knowledge of Docker
- Basic knowledge of docker-compose
- Scotch for celebration
Setting up Uptime Kuma with docker-compose
I will show you how to set this up with docker-compose. For those of you out there who prefer the pure docker command line experience, it works great that way too!
This example will be for a fresh docker-compose.yml file. It can be run anywhere that has access to the site and services you are wanting to monitor.
In a fresh docker-compose.yml file, add the following:
version: ‘3.3’

services:
  uptime-monitor:
    image: louislam/uptime-kuma:latest
    volumes:
      - ./data:/app/data
    restart: unless-stopped
Save the file and in a terminal run:
docker-compose up -d && docker-compose logs -f
Working with Uptime Kuma
Now you can open a web browser and start playing. Visit the URL where Docker is running. The default port is 3001.
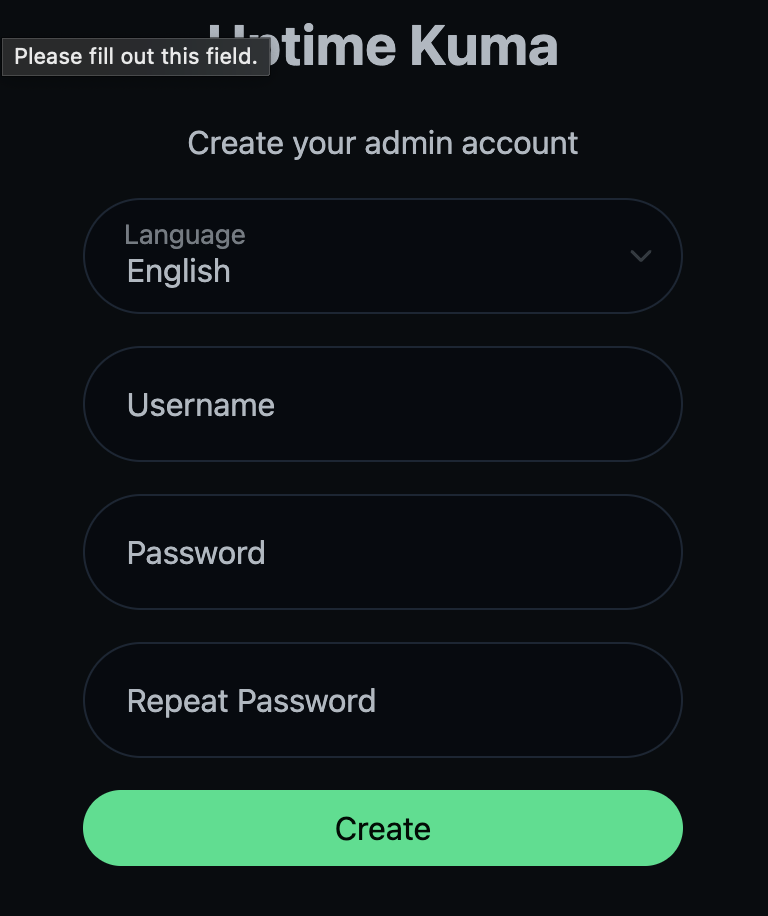
The first screen you see will be the registration screen. Create an admin user on this screen.
You will be taken to the Dashboard, where you can start adding services to monitor. Load it up with your entire infrastructure. Some of the things I like to track are:
- Websites
- API services
- DNS services
- Ping checks for non-HTTP services
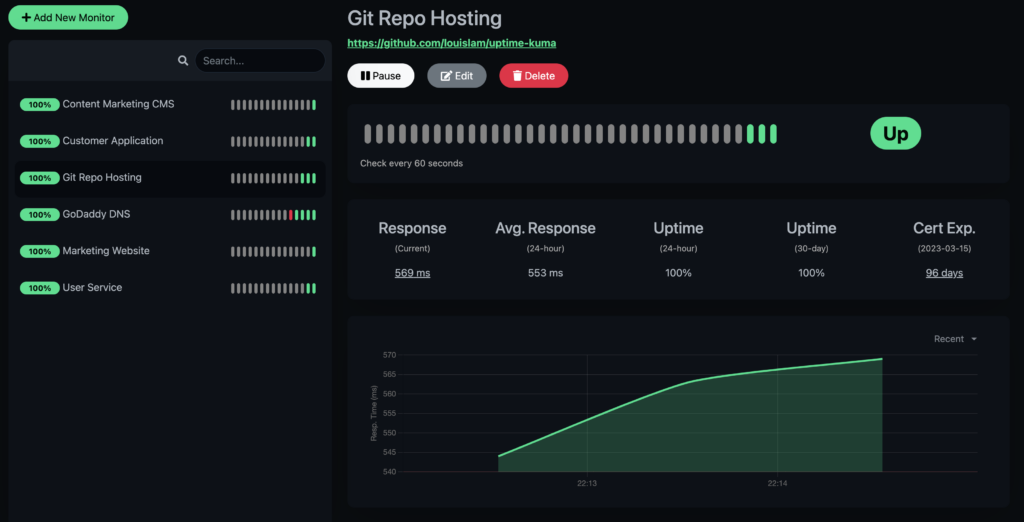
Optionally, you can create Status Pages. These are landing pages that you can craft with the services that you would like others to be able to monitor at a glance. This may include a production environment for your customers and stakeholders, and a development environment for your engineering team.

There you have it! Your very own uptime monitor, running with Docker, in minutes. Now you get to drink the scotch.
When I first tried out Uptime Kuma, from the first Docker command, I believe I was up and monitoring several services in less than 10 minutes.
I hope you enjoy Uptime Kuma as much as I am!